プロパティー | タイプ | 説明 |
|---|---|---|
layout | horizontal/ vertical | チャート内のラインの配置 デフォルト: 'horizontal’ |
syncId | string (option) | もし2つのカテゴリカルチャートが同じsyncIdを持っている場合、これら2つのチャートはツールチップとBrushの位置を同期させます。 |
syncMethod | index/ value/ function (option) | syncIdが提供されると、ツールチップとブラシの同期方法をカスタマイズできます。 デフォルト: 'index’ |
width | number | チャートコンテナの幅 |
height | number | チャートコンテナの高さ |
data | array | 表示するデータ フォーマット: [{name: 'a', value: 12}] |
margin | object | コンテナの周りの余白のサイズ。 デフォルト: { top: 5, right: 5, bottom: 5, left: 5 } フォーマット: { top: 5, right: 5, bottom: 5, left: 5 } |
barCategoryGap | Percentage| Number | 2つの棒カテゴリー間の間隔。これはパーセント値または固定値で指定できます。 デフォルト: ’10%’ |
barGap | Percentage| Number | 同じカテゴリ内の2つの棒の間隔 デフォルト: 4 |
barSize | number (option) | 各棒の幅または高さ。barSizeが指定されていない場合、棒のサイズはbarCategoryGap、barGap、および棒グループの量によって計算されます。例: Tiny BarChart |
maxBarSize | number | 水平BarChartのすべての棒の最大幅、または垂直BarChartの最大高さ。 |
stackOffset | 'expand' | 'none' | 'wiggle' | 'silhouette’ | シリーズ配列内の下部および上部の値を生成するために使用されるオフセット関数のタイプです。 これには d3-shape の組み込みの 4 つのオフセットタイプが含まれています。 デフォルト: ’none’ |
reverseStackOrder | boolean (option) | falseに設定されている場合、積み重ねられたアイテムは左から右にレンダリングされます。trueの場合、積み重ねられたアイテムは右から左にレンダリングされます。(レンダリングの方向はSVGのレイヤー配置に影響しますが、x座標には影響しません。) デフォルト: false |
onClick | function (option) | このチャート内でのクリックのカスタマイズされたイベントハンドラ。 |
onMouseEnter | function (option) | このチャート内でのmouseenterのカスタマイズされたイベントハンドラ。 |
onMouseMove | function (option) | このチャート内でのmousemoveのカスタマイズされたイベントハンドラ。 |
onMouseLeave | function (option) | このチャート内でのmouseleaveのカスタマイズされたイベントハンドラ。 |
Child Components
<XAxis />:x軸のデータ設定
<YAxis />:y軸のデータ設定
<ReferenceArea />:チャート上に影をつけるための参照エリアの定義
<ReferenceDot />:チャート上に参照ドットを配置する
<ReferenceLine />:チャート上に参照線を描画する
<Brush />:ズームおよび特定のエリアを選択するためのブラッシング機能を有効にする
<CartesianGrid />:チャートの背景グリッド表示。
通常、点線で水平および垂直のラインで構成。
strokeDasharrayの数字を大きくすればするほど、点線の粒度が荒くなります。
<Legend />:チャートの説明を提供する凡例の構成
<Tooltip />:データポイント上にウスホバーすると表示されるツールチップの設定
<Bar />:チャート内の個々の棒の設定
<Customized />:チャート要素をカスタムで描画するための機能
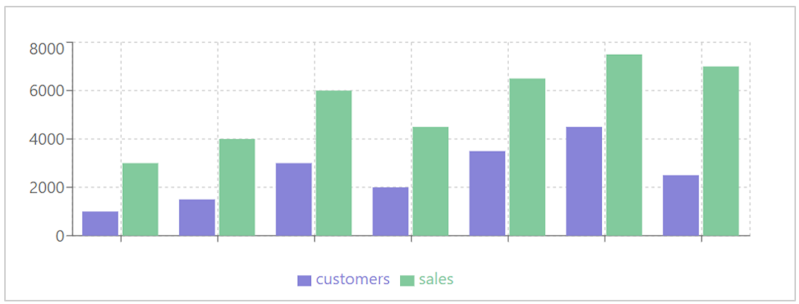
(1) シンプルバーチャート(Simple Bar Chart)
import React from "react";
import {
  XAxis,
  YAxis,
  CartesianGrid,
  Legend,
  BarChart,
  Bar,
} from "recharts";

//BarChart 用のサンプルデータ
const data = [
  {
    day: "MON",
    sales: 3000,
    customers: 1000,
  },
  {
    day: "TUE",
    sales: 4000,
    customers: 1500,
  },
  {
    day: "WED",
    sales: 6000,
    customers: 3000,
  },
  {
    day: "THU",
    sales: 4500,
    customers: 2000,
  },
  {
    day: "FRI",
    sales: 6500,
    customers: 3500,
  },
  {
    day: "SAT",
    sales: 7500,
    customers: 4500,
  },
  {
    day: "SUN",
    sales: 7000,
    customers: 2500,
  },
];

export default function Recharts() {
  return (
    <div>
      <BarChart width={730} height={250} data={data}>
        <CartesianGrid strokeDasharray="3 3" />
        <XAxis dataKey="data" />
        <YAxis />
        <Legend />
        <Bar dataKey="customers" fill="#8884d8" />
        <Bar dataKey="sales" fill="#82ca9d" />
      </BarChart>
    </div>
  );
}

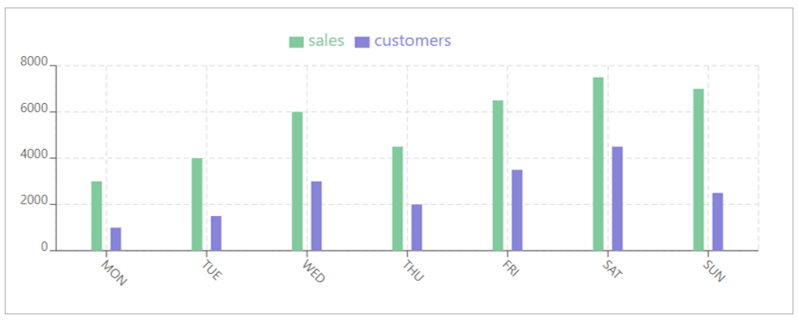
カスタマイズバーチャート(Customized Bar Chart)
import React from "react";
import {
  XAxis,
  YAxis,
  CartesianGrid,
  Tooltip,
  Legend,
  BarChart,
  Bar,
} from "recharts";

//BarChart 用のサンプルデータ
const data = [
  {
    day: "MON",
    sales: 3000,
    customers: 1000,
  },
  {
    day: "TUE",
    sales: 4000,
    customers: 1500,
  },
  {
    day: "WED",
    sales: 6000,
    customers: 3000,
  },
  {
    day: "THU",
    sales: 4500,
    customers: 2000,
  },
  {
    day: "FRI",
    sales: 6500,
    customers: 3500,
  },
  {
    day: "SAT",
    sales: 7500,
    customers: 4500,
  },
  {
    day: "SUN",
    sales: 7000,
    customers: 2500,
  },
];

export default function Recharts() {
  return (
    <div>
      {/*
        barGap:同じカテゴリ内の2つの棒の間隔
        barSize:各棒の幅または高さ
        reverseStackOrder:falseに設定されている場合、積み重ねられたアイテムは左から右にレンダリングされます。
      */}
      <BarChart
        width={730}
        height={250}
        data={data}
        barGap={8}
        barSize={10}
        reverseStackOrder={true}
      >
        {/* チャートの背景グリッド表示 */}
        <CartesianGrid stroke="#e0e0e0" strokeDasharray="5 3" />
        {/* X 軸のカスタマイズ(ラベルの角度、位置、スタイル) */}
        <XAxis
          dataKey="day"
          angle={45}
          tick={(props) => (
            <text
              x={props.x} // x座標
              y={props.y + 8} // y座標
              textAnchor="start" // アンカーポイントの設定("start" または "end" で右寄せのラベルに設定)
              fontSize={12} // フォントサイズ
              fill="#666" // フォントの色
              transform={`rotate(${45},${props.x},${props.y})`} // ラベルを回転
            >
              {props.payload.value}
            </text>
          )}
        />

        {/* Y 軸のカスタマイズ(ラベルの位置、スタイル) */}
        <YAxis
          tick={({ x, y, payload }) => (
            <text
              x={x}
              y={y}
              textAnchor="end" // アンカーポイントの設定("end" で右寄せのラベルに設定)
              fontSize={12} //フォントサイズ
              fill="#666" //フォントの色
            >
              {payload.value}
            </text>
          )}
        />
        {/* ホバー時の情報表示用のツールチップ */}
        <Tooltip />
        {/* チャートの凡例表示 */}
        <Legend verticalAlign="top" height={36} />
        {/* 'customers' データ用のエリア */}
        <Bar dataKey="customers" fill="#8884d8" />
        {/* 'sales' データ用のエリア */}
        <Bar dataKey="sales" fill="#82ca9d" />
      </BarChart>
    </div>
  );
}

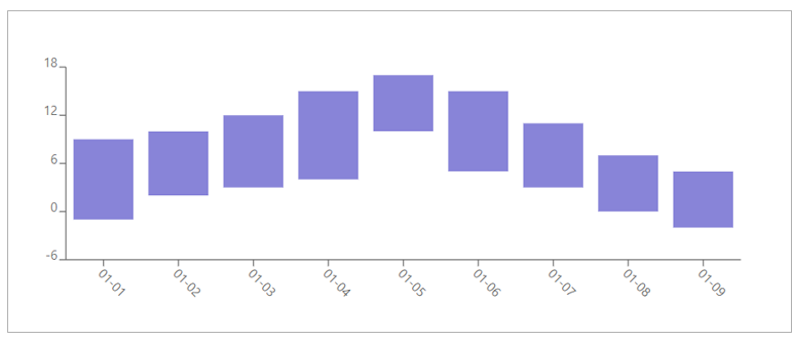
(2) 範囲バーチャート(Range Bar Chart)
import React from "react";
import {
  XAxis,
  YAxis,
  CartesianGrid,
  Tooltip,
  Legend,
  BarChart,
  Bar,
} from "recharts";

//BarChart 用のサンプルデータ
const rangeData = [
  {
    day: "01-01",
    temperature: [-1, 9],
  },
  {
    day: "01-02",
    temperature: [2, 10],
  },
  {
    day: "01-03",
    temperature: [3, 12],
  },
  {
    day: "01-04",
    temperature: [4, 15],
  },
  {
    day: "01-05",
    temperature: [10, 17],
  },
  {
    day: "01-06",
    temperature: [5, 15],
  },
  {
    day: "01-07",
    temperature: [3, 11],
  },
  {
    day: "01-08",
    temperature: [0, 7],
  },
  {
    day: "01-09",
    temperature: [-2, 5],
  },
];

export default function Recharts() {
  return (
    <div>
      <BarChart
        width={730}
        height={250}
        data={rangeData}
        margin={{ top: 20, right: 20, bottom: 20, left: 20 }}
      >
        {/* X 軸のカスタマイズ(ラベルの角度、位置、スタイル) */}
        <XAxis
          dataKey="day"
          angle={45}
          tick={(props) => (
            <text
              x={props.x} // x座標
              y={props.y + 8} // y座標
              textAnchor="start" // アンカーポイントの設定("start" または "end" で右寄せのラベルに設定)
              fontSize={12} // フォントサイズ
              fill="#666" // フォントの色
              transform={`rotate(${45},${props.x},${props.y})`} // ラベルを回転
            >
              {props.payload.value}
            </text>
          )}
        />
        {/* Y 軸のカスタマイズ(ラベルの位置、スタイル) */}
        <YAxis
          tick={({ x, y, payload }) => (
            <text
              x={x}
              y={y}
              textAnchor="end" // アンカーポイントの設定("end" で右寄せのラベルに設定)
              fontSize={12} //フォントサイズ
              fill="#666" //フォントの色
            >
              {payload.value}
            </text>
          )}
        />
        <Tooltip />
        <Bar dataKey="temperature" fill="#8884d8" />
      </BarChart>
    </div>
  );
}

この記事では、React Rechartsを使用してバーチャートを実装する基本的な手順をご紹介しました。
React Rechartsは非常に使いやすく、効果的なグラフ描画ライブラリであり、データのビジュアライゼーションを通じてアプリケーションのユーザーエクスペリエンス向上に大いに寄与します。
React Rechartsを巧みに活用して、素敵なデータ可視化を実現してください!
Happy coding!
DevpediaCode編集部
DevpediaCodeはWeb、AI、Iot、ローコードなどプログラムに関する最新ITテーマの情報を発信するメディアです。
お問合せ下記のURLからお願いします。
https://devpediacode.com/contact